
主题

服务器计时插件
¥Server Timing Plugin
此插件增加了使用服务器计时 API 审计性能瓶颈的支持。
¥This plugin adds support for auditing performance bottlenecks with Server Timing API
使用以下工具安装:
¥Install with:
bash
bun add @elysiajs/server-timing然后使用它:
¥Then use it:
typescript
import { Elysia } from 'elysia'
import { serverTiming } from '@elysiajs/server-timing'
new Elysia()
.use(serverTiming())
.get('/', () => 'hello')
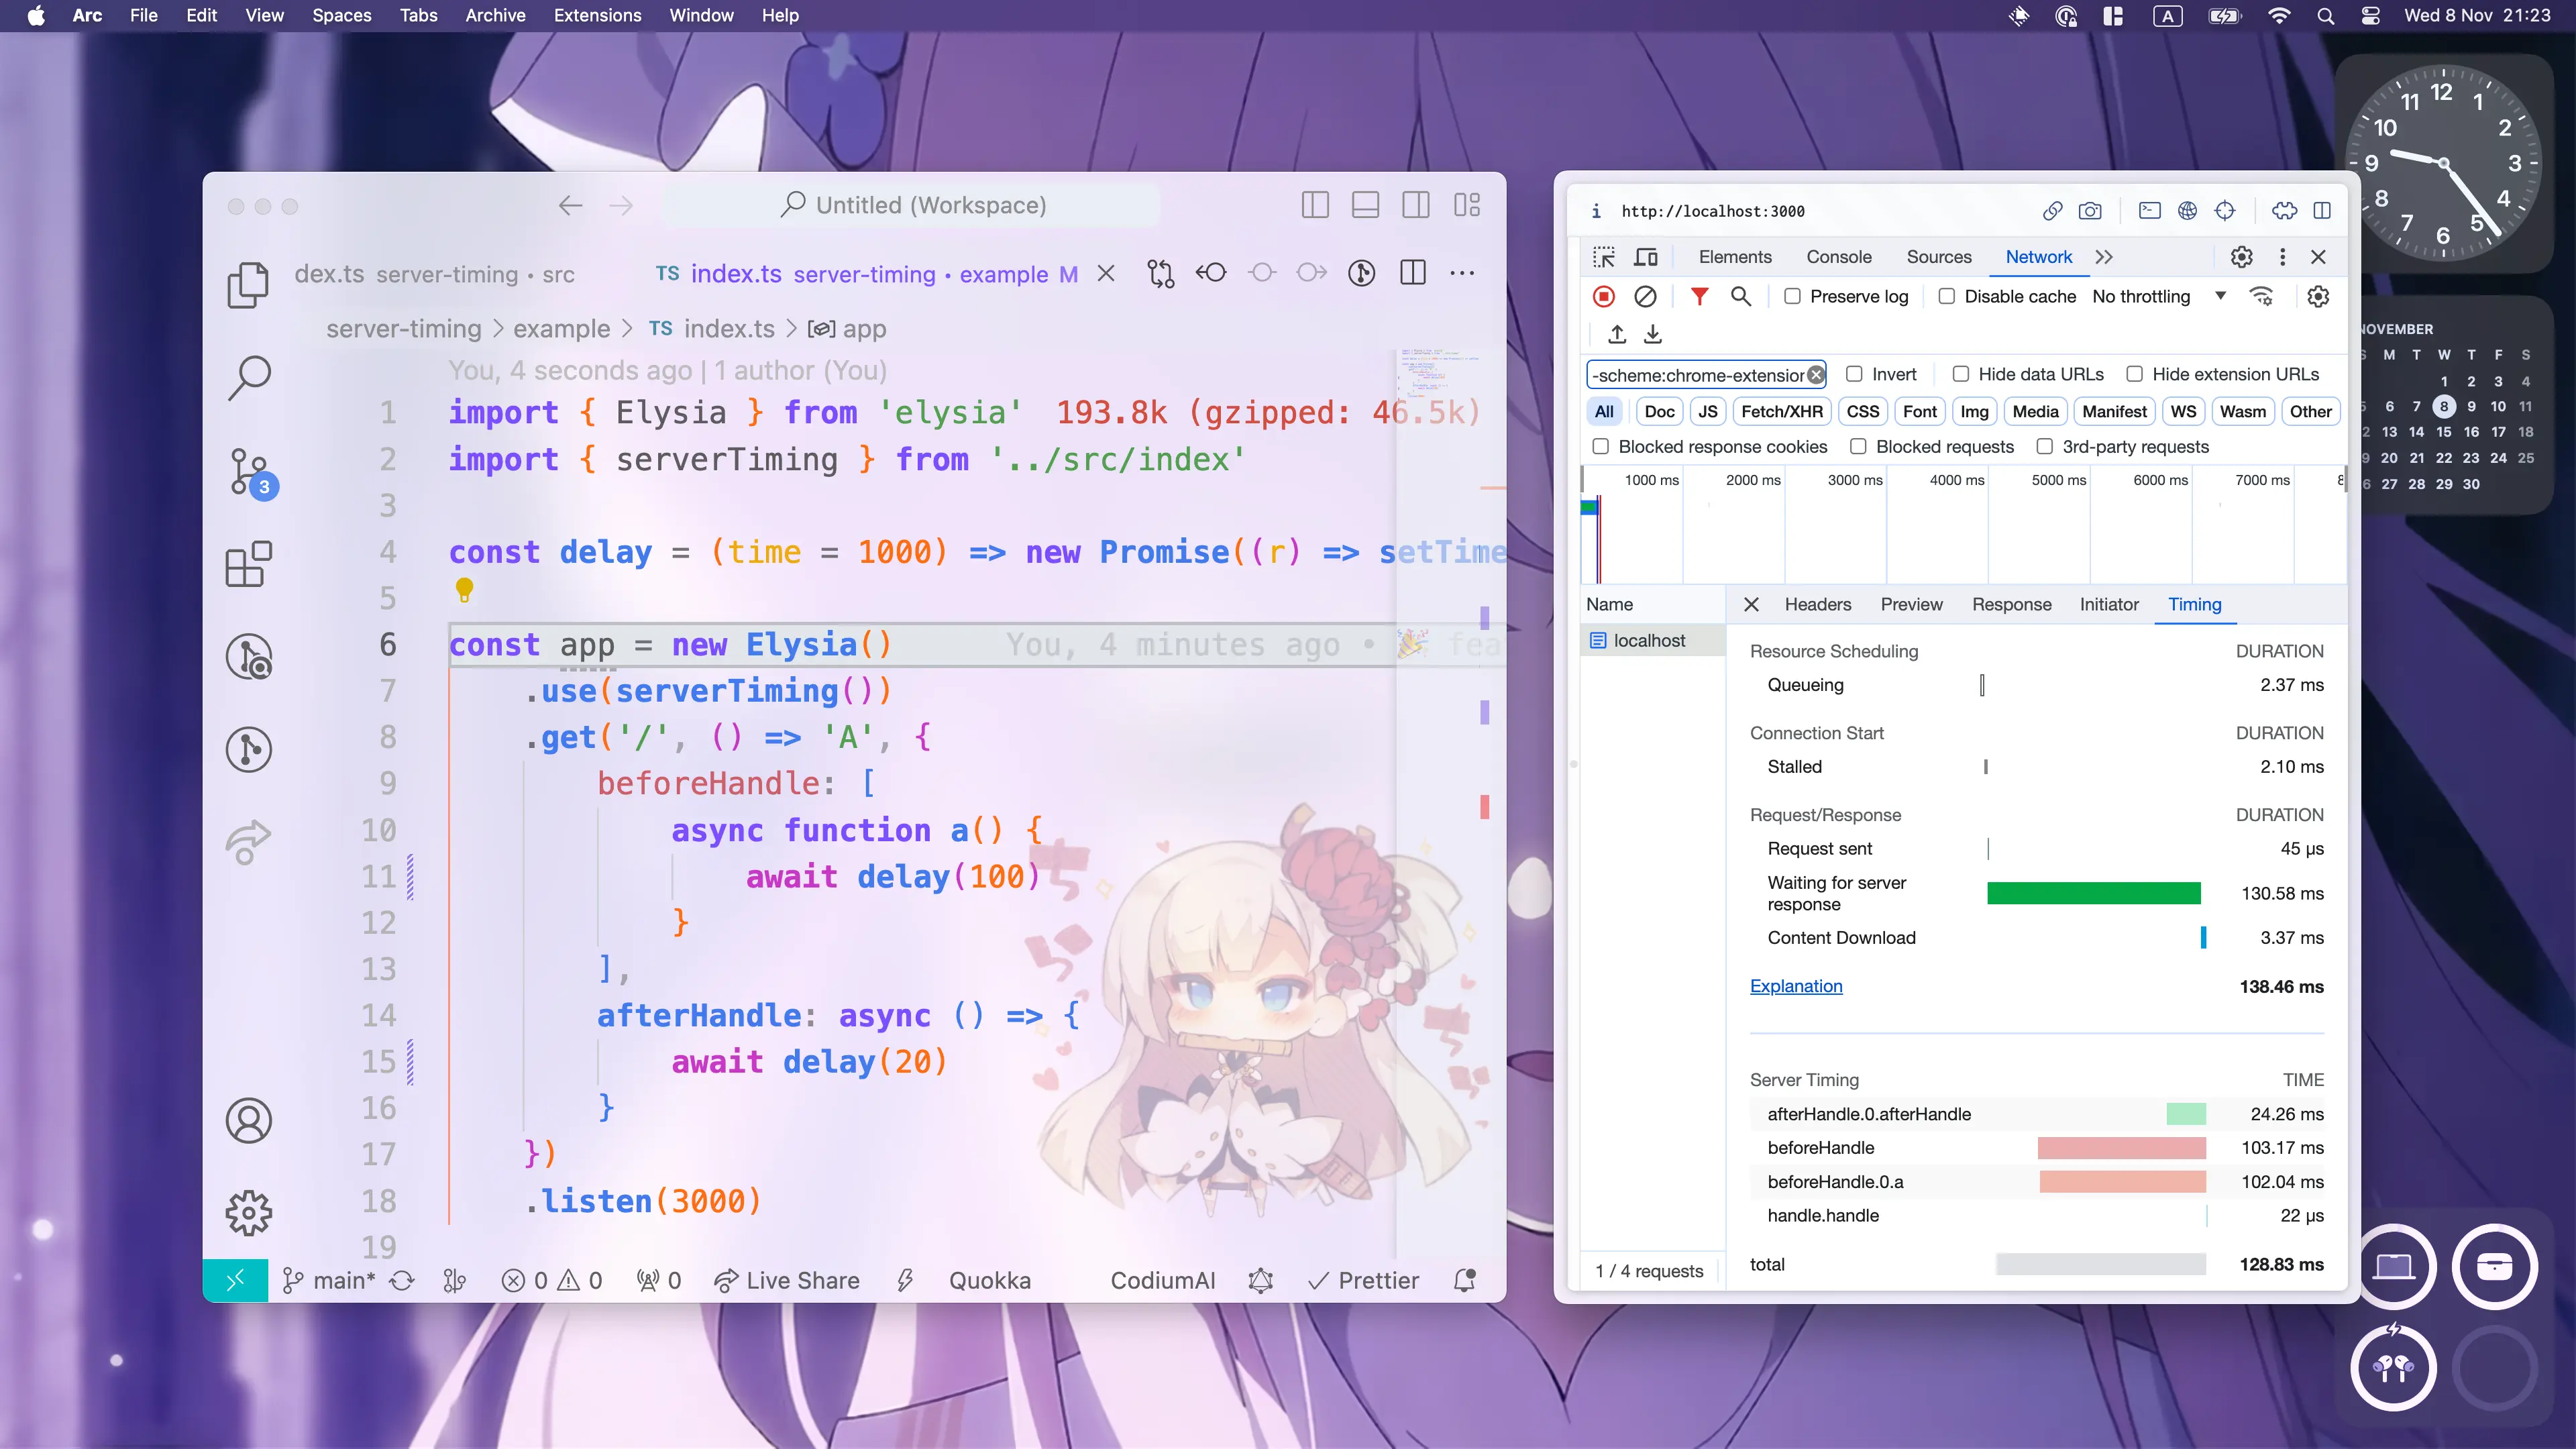
.listen(3000)Server Timing 随后会在 '服务器计时' 头中添加日志时长、函数名称以及每个生命周期函数的详细信息。
¥Server Timing then will append header 'Server-Timing' with log duration, function name, and detail for each life-cycle function.
要检查,请打开浏览器开发者工具 > 网络 > [通过 Elysia 服务器发出的请求] > 时间。
¥To inspect, open browser developer tools > Network > [Request made through Elysia server] > Timing.
现在你可以轻松审计服务器的性能瓶颈。
¥Now you can effortlessly audit the performance bottleneck of your server.
配置
¥Config
以下是插件接受的配置。
¥Below is a config which is accepted by the plugin
enabled
@default NODE_ENV !== 'production'
确定是否应启用服务器计时
¥Determine whether or not Server Timing should be enabled
allow
@default undefined
服务器计时是否应记录的条件
¥A condition whether server timing should be log
trace
@default undefined
允许服务器计时记录指定的生命周期事件:
¥Allow Server Timing to log specified life-cycle events:
Trace 接受以下对象:
¥Trace accepts objects of the following:
请求:从请求捕获时长
解析:从解析捕获时长
转换:从转换捕获时长
beforeHandle:从 beforeHandle 捕获时长
句柄:从句柄捕获时长
afterHandle:从 afterHandle 捕获时长
总计:捕获从开始到结束的总时长
模式
¥Pattern
以下是使用该插件的常见模式。
¥Below you can find the common patterns to use the plugin.
允许条件
¥Allow Condition
你可以通过 allow 属性禁用特定路由上的服务器计时。
¥You may disable Server Timing on specific routes via allow property
ts
import { Elysia } from 'elysia'
import { serverTiming } from '@elysiajs/server-timing'

new Elysia()
    .use(
        serverTiming({
            allow: ({ request }) => {
                return new URL(request.url).pathname !== '/no-trace'
            }
        })
    )