
主题

OpenTelemetry
要开始使用 OpenTelemetry,请安装 @elysiajs/opentelemetry 并将插件应用于任何实例。
¥To start using OpenTelemetry, install @elysiajs/opentelemetry and apply plugin to any instance.
typescript
import { Elysia } from 'elysia'
import { opentelemetry } from '@elysiajs/opentelemetry'

import { BatchSpanProcessor } from '@opentelemetry/sdk-trace-node'
import { OTLPTraceExporter } from '@opentelemetry/exporter-trace-otlp-proto'

new Elysia().use(
	opentelemetry({
		spanProcessors: [new BatchSpanProcessor(new OTLPTraceExporter())]
	})
)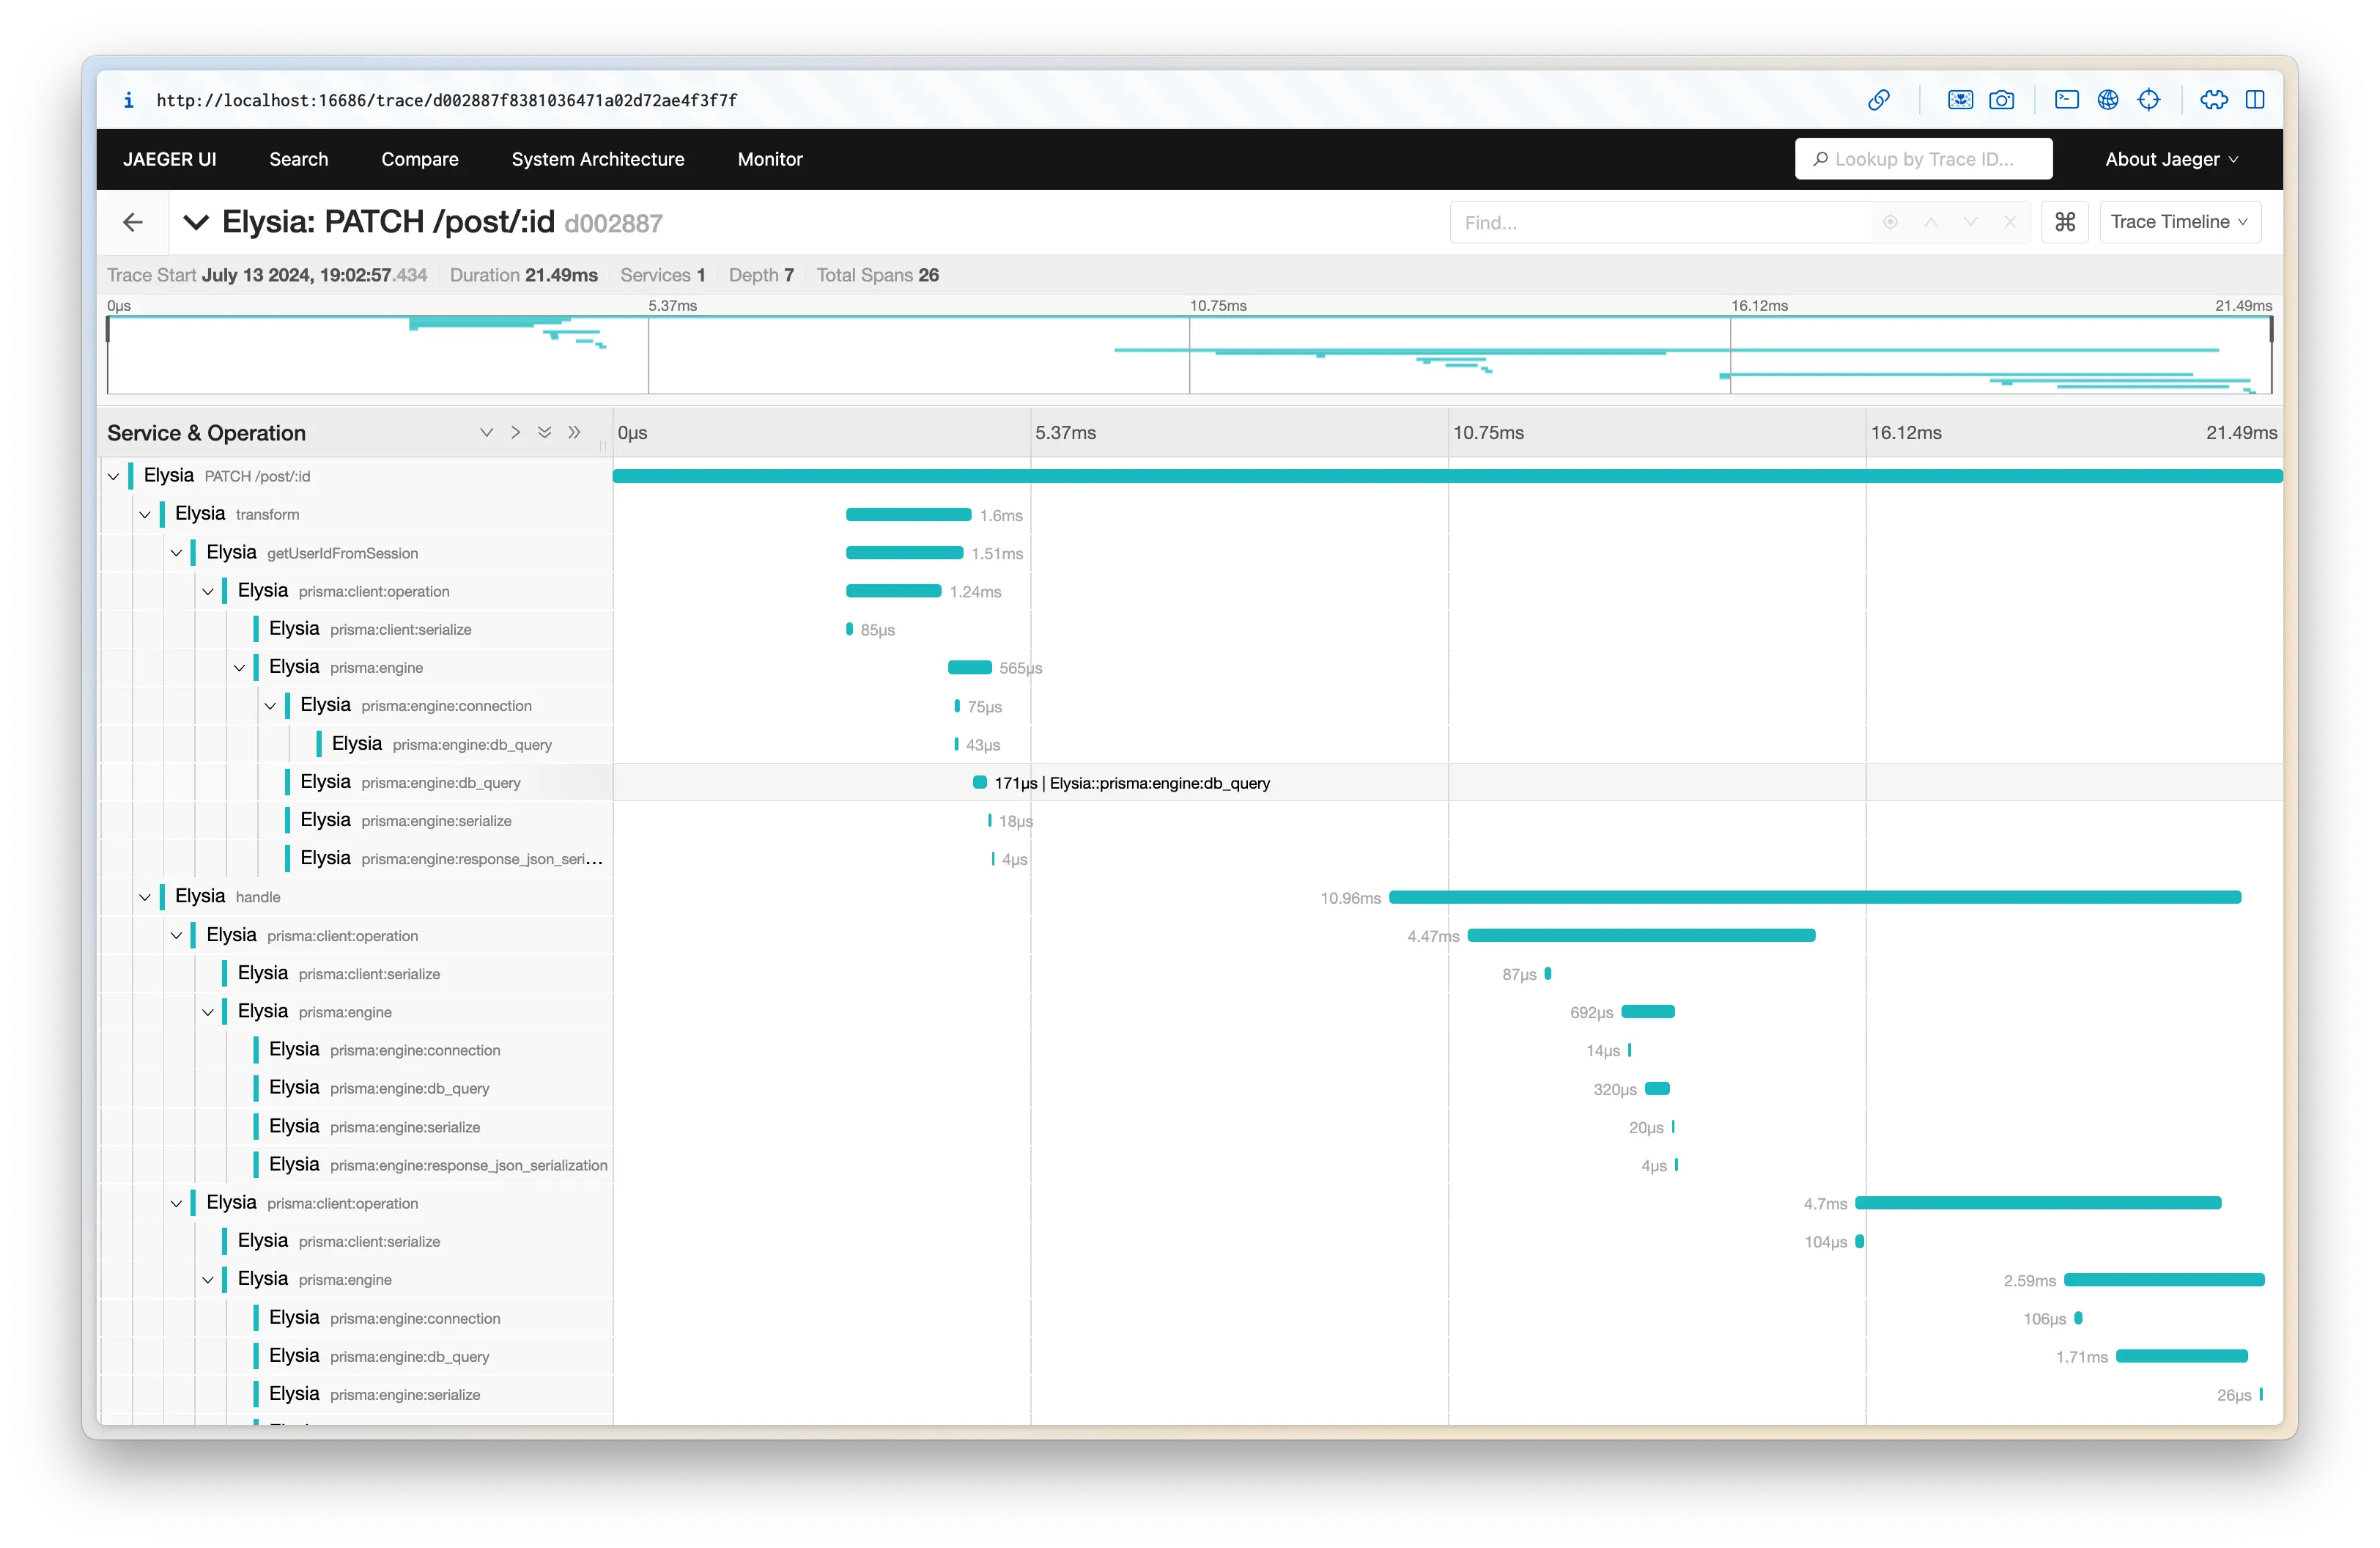
Elysia OpenTelemetry 将收集任何兼容 OpenTelemetry 标准的库的 span,并自动应用父级和子级 span。
¥Elysia OpenTelemetry will collect span of any library compatible with OpenTelemetry standard, and will apply parent and child span automatically.
在上面的代码中,我们应用 Prisma 来跟踪每个查询的耗时。
¥In the code above, we apply Prisma to trace how long each query took.
通过应用 OpenTelemetry,Elysia 将:
¥By applying OpenTelemetry, Elysia will then:
收集遥测数据
将相关生命周期分组
测量每个函数的执行时间
检测 HTTP 请求和响应
收集错误和异常
你可以将遥测数据导出到 Jaeger、Zipkin、New Relic、Axiom 或任何其他兼容 OpenTelemetry 的后端。
¥You may export telemetry data to Jaeger, Zipkin, New Relic, Axiom or any other OpenTelemetry compatible backend.
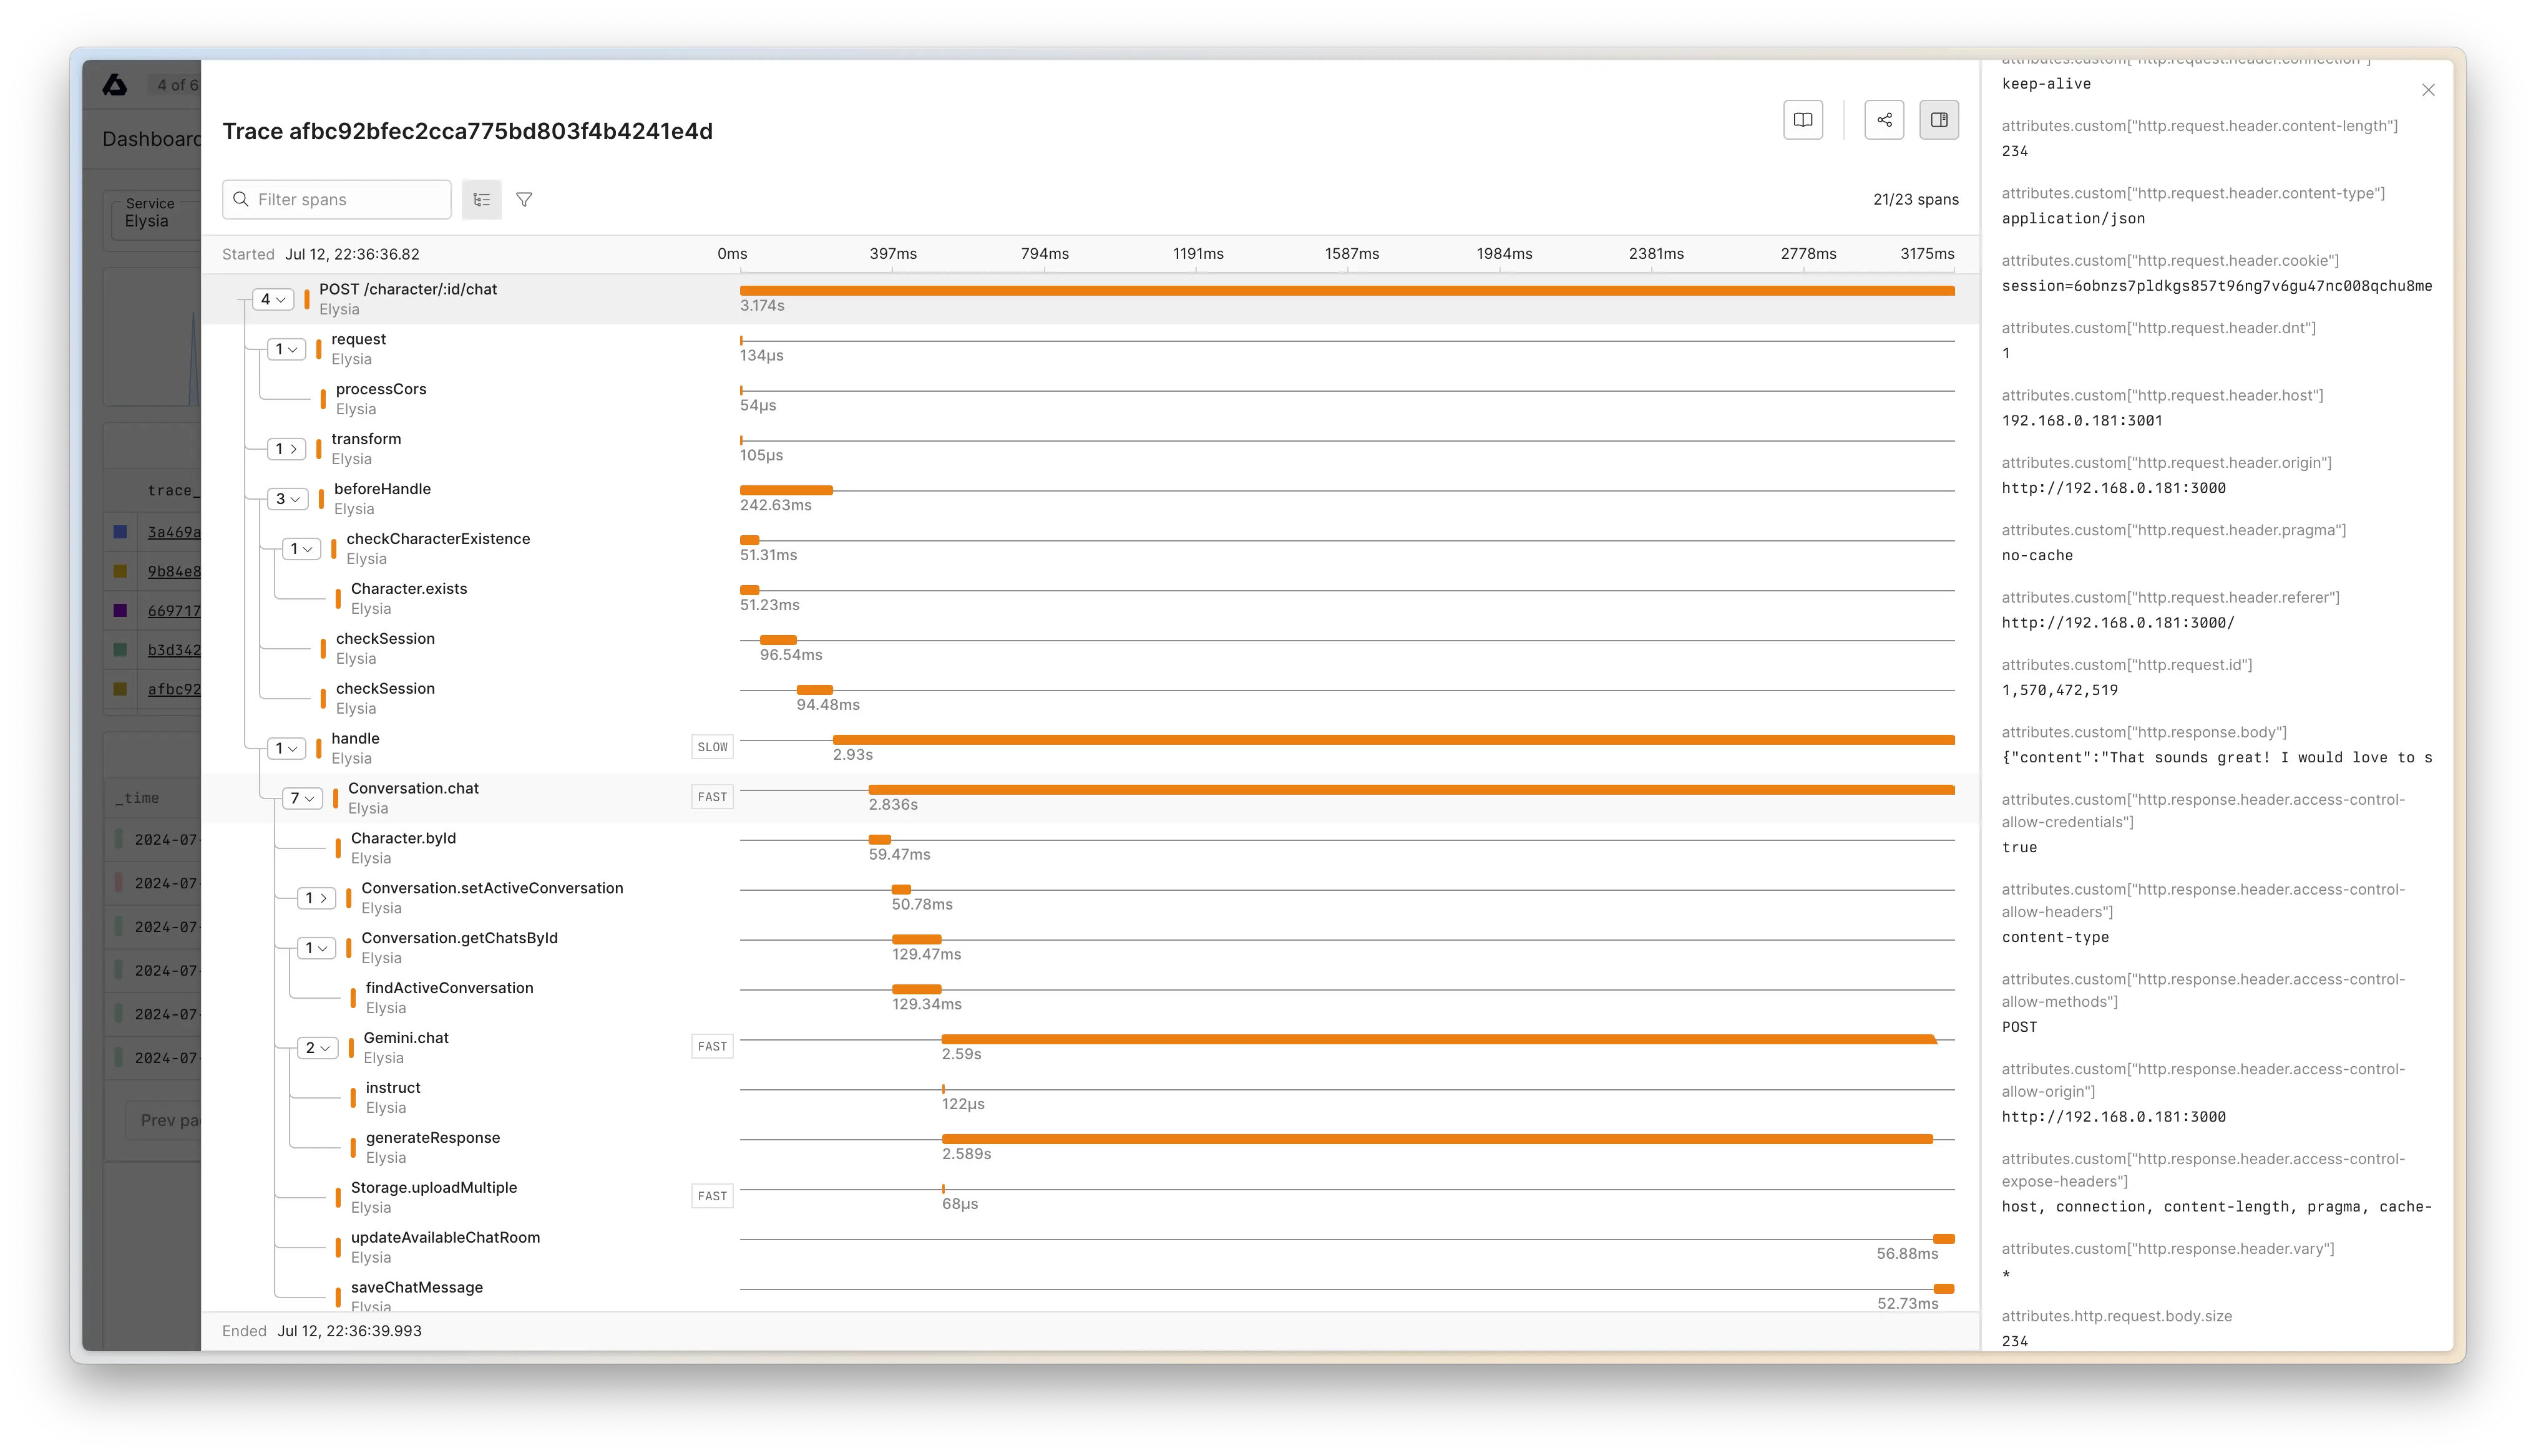
以下是将遥测数据导出到 Axiom 的示例
¥Here's an example of exporting telemetry to Axiom
typescript
import { Elysia } from 'elysia'
import { opentelemetry } from '@elysiajs/opentelemetry'

import { BatchSpanProcessor } from '@opentelemetry/sdk-trace-node'
import { OTLPTraceExporter } from '@opentelemetry/exporter-trace-otlp-proto'

new Elysia().use(
	opentelemetry({
		spanProcessors: [
			new BatchSpanProcessor(
				new OTLPTraceExporter({
					url: 'https://api.axiom.co/v1/traces',
					headers: {
						Authorization: `Bearer ${Bun.env.AXIOM_TOKEN}`,
						'X-Axiom-Dataset': Bun.env.AXIOM_DATASET
					}
				})
			)
		]
	})
)
仪器
¥Instrumentations
许多插桩库要求 SDK 必须在导入模块之前运行。
¥Many instrumentation libraries required that the SDK MUST run before importing the module.
例如,要使用 PgInstrumentation,必须在导入 pg 模块之前运行 OpenTelemetry SDK。
¥For example, to use PgInstrumentation, the OpenTelemetry SDK must run before importing the pg module.
要在 Bun 中实现这一点,我们可以
¥To achieve this in Bun, we can
- 将 OpenTelemetry 设置分离到另一个文件中
- 创建
bunfig.toml以预加载 OpenTelemetry 设置文件
让我们在 src/instrumentation.ts 中创建一个新文件
¥Let's create a new file in src/instrumentation.ts
ts
import { opentelemetry } from '@elysiajs/opentelemetry'
import { PgInstrumentation } from '@opentelemetry/instrumentation-pg'

export const instrumentation = opentelemetry({
	instrumentations: [new PgInstrumentation()]
})
然后我们可以将这个 instrumentaiton 插件应用到 src/index.ts 的主实例中。
¥Then we can apply this instrumentaiton plugin into our main instance in src/index.ts
ts
import { Elysia } from 'elysia'
import { instrumentation } from './instrumentation.ts'

new Elysia().use(instrumentation).listen(3000)
然后创建一个 bunfig.toml,内容如下:
¥Then create a bunfig.toml with the following:
toml
preload = ["./src/instrumentation.ts"]这将告诉 Bun 在运行 src/index.ts 之前加载并设置 instrumentation,以便 OpenTelemetry 根据需要进行设置。
¥This will tell Bun to load and setup instrumentation before running the src/index.ts allowing OpenTelemetry to do its setup as needed.
部署到生产环境
¥Deploying to production
如果你使用 bun build 或其他打包器。
¥If you are using bun build or other bundlers.
由于 OpenTelemetry 依赖于 monkey-patching node_modules/<library>。为了使 make instrumentations 正常工作,我们需要将要被 instrument 的库指定为外部模块,以将其排除在打包之外。
¥As OpenTelemetry rely on monkey-patching node_modules/<library>. It's required that make instrumentations works properly, we need to specify that libraries to be instrument is an external module to exclude it from being bundled.
例如,如果你使用 @opentelemetry/instrumentation-pg 来检测 pg 库。我们需要将 pg 从打包包中排除,并确保它导入 node_modules/pg。
¥For example, if you are using @opentelemetry/instrumentation-pg to instrument pg library. We need to exclude pg from being bundled and make sure that it is importing node_modules/pg.
为了使其正常工作,我们可以使用 --external pg 将 pg 指定为外部模块。
¥To make this works, we may specified pg as an external module with --external pg
bash
bun build --compile --external pg --outfile server src/index.ts这告诉 bun 不要将 pg 打包到最终输出文件中,而是在运行时从 node_modules 目录导入。所以,在生产服务器上,你还必须保留 node_modules 目录。
¥This tells bun to not pg bundled into the final output file, and will be imported from the node_modules directory at runtime. So on a production server, you must also keeps the node_modules directory.
建议在 package.json 中将生产服务器中应可用的软件包指定为依赖,并使用 bun install --production 仅安装生产依赖。
¥It's recommended to specify packages that should be available in a production server as dependencies in package.json and use bun install --production to install only production dependencies.
json
{
	"dependencies": {
		"pg": "^8.15.6"
	},
	"devDependencies": {
		"@elysiajs/opentelemetry": "^1.2.0",
		"@opentelemetry/instrumentation-pg": "^0.52.0",
		"@types/pg": "^8.11.14",
		"elysia": "^1.2.25"
	}
}
然后在生产服务器上运行构建命令后,
¥Then after running a build command, on a production server
bash
bun install --production如果 node_modules 目录仍然包含开发依赖,你可以删除 node_modules 目录并重新安装生产依赖。
¥If the node_modules directory still includes development dependencies, you may remove the node_modules directory and reinstall production dependencies again.
OpenTelemetry SDK
Elysia OpenTelemetry 仅用于将 OpenTelemetry 应用于 Elysia 服务器。
¥Elysia OpenTelemetry is for applying OpenTelemetry to Elysia server only.
你可以正常使用 OpenTelemetry SDK,并且 span 在 Elysia 的请求 span 下运行,它将自动显示在 Elysia 跟踪中。
¥You may use OpenTelemetry SDK normally, and the span is run under Elysia's request span, it will be automatically appear in Elysia trace.
然而,我们还提供了 getTracer 和 record 实用程序,用于从应用的任何部分收集 span。
¥However, we also provide a getTracer, and record utility to collect span from any part of your application.
typescript
import { Elysia } from 'elysia'
import { record } from '@elysiajs/opentelemetry'

export const plugin = new Elysia().get('', () => {
	return record('database.query', () => {
		return db.query('SELECT * FROM users')
	})
})
记录实用程序
¥Record utility
record 相当于 OpenTelemetry 的 startActiveSpan,但它可以处理自动关闭并自动捕获异常。
¥record is an equivalent to OpenTelemetry's startActiveSpan but it will handle auto-closing and capture exception automatically.
你可以将 record 视为代码的标签,该标签将显示在跟踪中。
¥You may think of record as a label for your code that will be shown in trace.
为可观察性准备代码库
¥Prepare your codebase for observability
Elysia OpenTelemetry 将对生命周期进行分组,并将每个钩子的函数名称读取为 span 的名称。
¥Elysia OpenTelemetry will group lifecycle and read the function name of each hook as the name of the span.
现在是时候命名你的函数了。
¥It's a good time to name your function.
如果你的钩子处理程序是箭头函数,你可以将其重构为命名函数以便更好地理解跟踪,否则,你的跟踪跨度将被命名为 anonymous。
¥If your hook handler is an arrow function, you may refactor it to named function to understand the trace better, otherwise your trace span will be named as anonymous.
typescript
const bad = new Elysia()
	// ⚠️ span name will be anonymous
	.derive(async ({ cookie: { session } }) => {
		return {
			user: await getProfile(session)
		}
	})

const good = new Elysia()
	// ✅ span name will be getProfile
	.derive(async function getProfile({ cookie: { session } }) {
		return {
			user: await getProfile(session)
		}
	})
getCurrentSpan
getCurrentSpan 是一个实用程序,用于在处理程序之外获取当前请求的当前跨度。
¥getCurrentSpan is a utility to get the current span of the current request when you are outside of the handler.
typescript
import { getCurrentSpan } from '@elysiajs/opentelemetry'

function utility() {
	const span = getCurrentSpan()
	span.setAttributes({
		'custom.attribute': 'value'
	})
}
这在处理程序之外工作,通过从 AsyncLocalStorage 检索当前跨度来实现。
¥This works outside of the handler by retriving current span from AsyncLocalStorage
setAttributes
setAttributes 是一个实用程序,用于将属性设置为当前跨度。
¥setAttributes is a utility to set attributes to the current span.
typescript
import { setAttributes } from '@elysiajs/opentelemetry'

function utility() {
	setAttributes({
		'custom.attribute': 'value'
	})
}
这是 getCurrentSpan().setAttributes 的语法糖
¥This is a syntax sugar for getCurrentSpan().setAttributes
配置
¥Configuration
有关配置选项和定义,请参阅 opentelemetry 插件。
¥See opentelemetry plugin for configuration option and definition.